

 As the global population continues to grow, the environmental challenges of producing animal-based proteins are becoming increasingly apparent. At the same time, plant-based alternatives often fall short of replicating the sensory and taste experiences associated with traditional cheese. Fermify is addressing this gap with an innovative approach to milk protein production that eliminates the need for cows. The company offers a decentralized production model, enabling food manufacturers to produce milk proteins directly at their cheese production facilities. This eliminates the need for transport and drying steps, reducing associated resource use and emissions. Fermify's fully automated B2B platform provides a comprehensive solution for casein production, tailored to enhance the quality, sustainability, and scalability of alternative cheese and functional ingredient products. By equipping large food companies with the tools to produce high-quality milk proteins on-site, Fermify aims to transform the dairy industry and support a shift toward more sustainable food systems. Index
Analysis ParametersGoal and scopeFunctional UnitTon of fermify's Vegan Protein (Casein) The functional unit that is used for this analysis is the production of 1 tonne of protein (casein). BenchmarkCow Milk-Based Protein The benchmark shows the emissions avoided from producing the equivalent amount of protein from cow milk. Reference flowThe reference flow is the production of 1 tonne of milk protein from cow milk. GoalThe goal of this study is to map out the production steps of one tonne of vegan milk protein and measure its related emissions. This way it can be compared to the emissions of the production of one tonne of cow milk protein, which is produced the conventional way. Showing potential emission reductions from this comparison is the goal of the study. Reason for studyHaving a direct comparison of the emissions from vegan cheese protein and cow milk protein, will help decision-making on product development/ improvement and more generally spoken the strategic development of the company. The better the company knows about their own products emissions profile (especially compared to the incumbent product) the better it can work on further reducing carbon emissions and market its product. AudienceThe intended audience is the staff from Fermify and interested third parties, such as investors or governmental bodies. ScopeSystem BoundaryThe system boundary encompasses the product from cradle to grave, including all the activities from sourcing of required materials to the end-of-life downstream-recycling. The analysis considers Scope 1, 2 and 3 emissions of Fermify’s milkless cheese production. LifetimeThe milkless cheese has an average lifetime of a week before it gets mouldy. Afterwards there is a potential to compost it. This is, however, not considered quantitatively in this analysis, as this is up to the consumers. MethodologyMeeting international standardsThis analysis adheres to Lifecycle Assessment (LCA) methodologies outlined in ISO 14040, 14044, and 14067, ensuring a structured approach, potential comparability between solutions, and transparency for readers. The report is based on data available during the study and within the agreed scope. Results reflect the best available data and methodologies, with accuracy and reliability dependent on data quality and completeness at the time of the study. Limitations or uncertainties in the data are explicitly stated. The data used is precise (considering uncertainties and variability), complete (capturing all inflows and outflows within system boundaries), representative (aligned with geography, time, and technology), and consistent. It should be noted that LCA results depend on system boundaries, allocation methods, data quality, and assumptions; where deviations may affect outcomes. ClimatePoint impact analysts herein apply professional judgment and relevant standards while maintaining client confidentiality. Data QualityTechnology coverageThe technology by Fermify represents a technology mix weighted average of the actual process mix in the market segment that Fermify is part of. As there are other companies producing or supporting the production of vegan cheese, the company's solution can be seen as technology mix weighted average. Temporal coverageThe time of the study is 2023. The data that is provided by Fermify is the most current data available. Geographical boundaryThe company is located in Vienna in Austria, however has international clients in Europe and the US. Therefore, the geographical boundary can be set to Europe and the US. Assumptions and limitationsThis analysis only considers the cheese protein production and not the cheese production as such. As Fermify only provides the equipment (machinery) and input material for producing cheese protein, the analysis excludes any emissions from cheese production itself. Functional UnitTon of fermify's Vegan Protein (Casein) Executive SummaryKey revelationsThe greatest avoided emissions can be attributed to the sourcing of input materials meaning the whole protein (casein) production up until the phase where the protein is turned into cheese. The customer builds hardware stage is the greatest source of emissions for Fermify. This can be explained by the large amounts of steel that is used to build the casein production skids. The analysis showed that Fermify’s cheese can reduce the overall CO2 emissions of casein production considerably. However, regarding the cheese production itself, it is difficult to claim avoided emissions, as modelling the cheese production process as a benchmark has proven not to be very similar. Insights to Impact StrategyTo maximise avoided emissions Fermify should focus on the hardware transported to the customer, the operational electricity and potentially the cheese production process itself. The first two processes have the highest emissions among all processes and therefore should be a high priority to Fermify. The cheese production process could not have been modelled in this report but is an additional source of potential emissions that should be focused on. Potential ChallengesThere is a large potential to avoid carbon emissions during the casein production with Fermify’s production technique. Modelling the carbon emissions of the full cheese production process has proven to be rather difficult. This was the case mainly due to many uncertainties in the benchmark process. Therefore, we advise to have a second consecutive report that can model Fermify’s cheese production, using conventional cheese production as benchmark, more in detail. Possible ReboundsThe processes ‘customer builds, hardware’, ‘transport of input material to customer’, ‘transport of microbial strains to customer’ and ‘operational electricity’ are considered rebound processes, as they all potentially result in additional emissions. However, compared to conventional milk protein production, only the hardware that is transported to the customer can be considered an additional rebound process. Due to its large material input of stainless steel, the hardware is an additional source of carbon emissions. Being able to use hardware for the production of Fermify’s protein that is normally used for milk protein production could lead to significant avoided emissions. Climate Value PropositionThis technology's climate value lies in its potential as a sustainable alternative for conventional cheese (production). The reduction of embodied emissions occurs mainly in Scope 2 upstream by limiting the sourcing of material inputs compared to conventional cheese protein production. Life Cycle OverviewUnderstanding your emission profileThis process summary depicts an overview of the most significant emission factors that take place throughout your lifecycle activity. By viewing these intensities alongside each other, you can gauge their relative importance with respect to positive and negative extremes. Each process item listed on the horizontal axis will be described further in the Scope Allocation Analysis where readers can dive into the details behind each of the data points. While this model represents the complete overview, we make sure that each factor is supported by a sound methodology. Building your impact foundationSome process items may remain blank because the ClimatePoint team has considered them to be out of project scope, insignificant, or without enough information to analyse. These gaps should eventually be completed as you aim for your emission profile to approach higher levels of accuracy. Because of this presentation, you can understand which additional data is necessary to complete your entire impact profile and accommodate the dynamic growth and scalability of your company. ClimatePoint is here to help you navigate this pathway and optimize your impact strategy. Benchmark: Cow Milk-Based ProteinImpact Category: Climate change Process Overview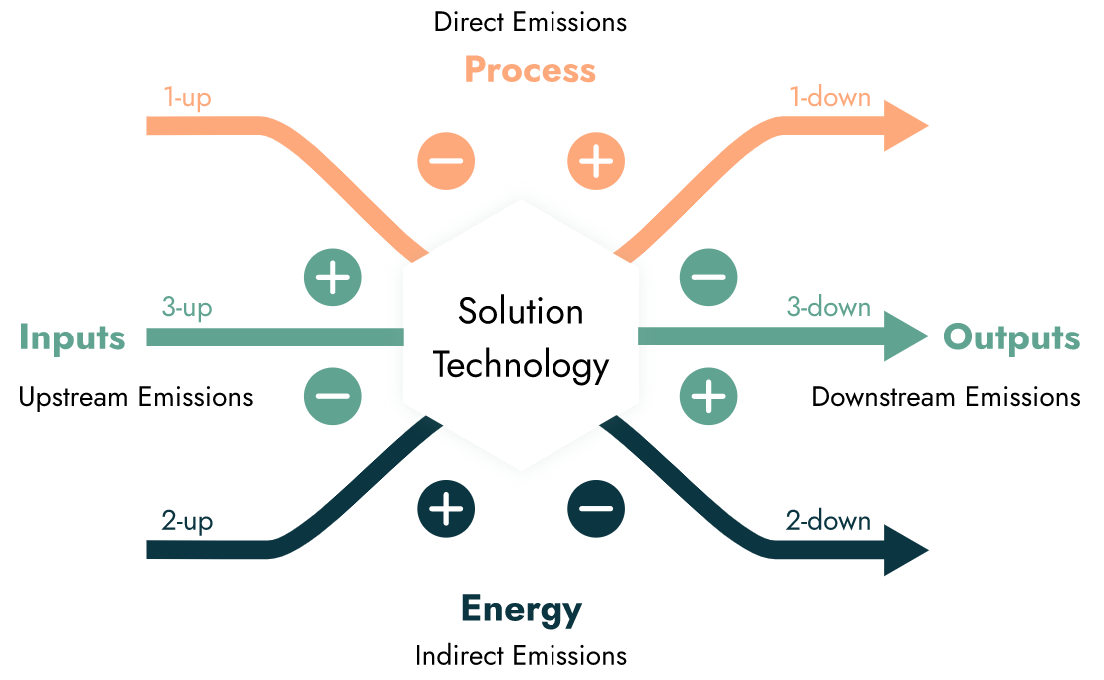 Connecting academia with businessThe scope allocation analysis is the ClimatePoint strategy to bridge the LCA emission assessment to the world of corporate GHG reporting. When our team approaches a new technology, we start with the most significant aspects that outline both your generated emissions and your avoided emission impact. The following process items represent these key factors backed by a defined methodology approach. This format permits the technology to be strategically aligned with our global climate targets, challenged for verification, and refined with evolution and growth. As the climate solution matures, we can easily update or add process items making this a truly dynamic report. This ClimatePoint approach integrates impact foundations outlined by the international community. To help you interpret the key climate aspects of your technology, we assign each process item two labels to serve as high level indicators. Your most significant climate impactThe "Score" evaluates processes based on comparative impact: Aligned signifies measurable emission reductions compared to the benchmark; Potential suggests possible alignment pending further verification; Negative denotes additional emissions; Rebound identifies emissions that would have otherwise not occurred with the benchmark; and None represents qualitative assessments. The "Priority" label ranks processes by importance: High indicates critical processes essential for achieving key sustainability objectives, warranting immediate attention; Medium represents processes contributing to the impact profile that require attention but lack urgency; and Low applies to supplementary processes with less immediate impact or those already aligned, allowing deferred action until higher-priority tasks are addressed. # Process item Scope Score Priority Impact AnalysisFunctional unit profileThis graph represents the aggregation of all the aforementioned emission factors with respect to the defined functional unit. By selecting a benchmark, the corresponding avoided emissions will also be displayed on the graph. This enables you to see the difference in the emission profile that this climate solution has to the incumbent technology. There is also an effect filter to identify which impact factors only occur once and which recur multiple times, usually throughout the lifetime use of the product or service. You can click the process labels in the legend to hide and show different elements to reveal further insights.
ProjectionsHow to read this section
Scenario 1: Fermify's expectations (planned impact)This scenario is based on Fermify's expectations of scaling over the coming years. This means having, in total, the following numbers of modules in use: 9 (2024), 21 (2025), 39 (2026), 48 (2027), 56 (2028), 60 (2029), 61 (2030). Each of these modules is assumed to produce 54 tonnes of protein in its first year of operation, 90 tonnes of protein in its second year of operation, and 133 tonnes of protein from its third year onwards. The data on the efficiency increase was Benchmark 1: Cow Milk-Based ProteinThe benchmark shows the emissions avoided from producing the equivalent amount of protein from cow milk. Scenario 2: One unit per year, starting 2023 (+one skid)Benchmark 1: Cow Milk-Based ProteinThe benchmark shows the emissions avoided from producing the equivalent amount of protein from cow milk. |
ClimatePoint Funding the Future ClimatePoint AS Universitetsgata 12, 0157 Oslo |
ClimatePoint AS, Universitetsgata 12, 0157 Oslo Follow us on X | Follow us on LinkedIn |