

Life Cycle Analysis No-burn rice farming practice Alternative to open-field burning Facilitating Solution 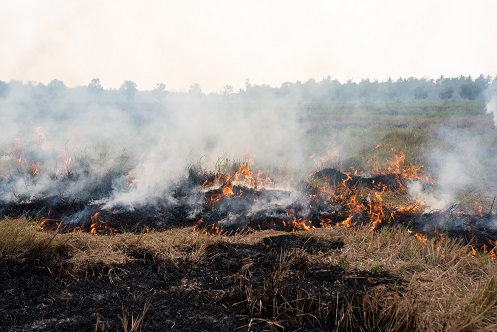 Every year, more than 300,000 Myanmar rice farmers burn 2.3 million acres of farmland to prepare for the next growing season. Proximity Design's no-burn rice farming aims to mitigate more than 7 million tons of CO2 emissions, restore soil health, and improve incomes for farmers. Farmers traditionally burn crop rice straw residues in open fields to quickly clear the land for the next growing season. For the smallholder, this burning method is the most common, convenient, and often the only option for farmers to prepare the land within three to four weeks. This timeline is motivated by the opportunity for the farmer to have two crop cycles per year. However, this practice leads to 7 million tonnes of CO2 emitted to the atmosphere each year. This also releases dangerous levels of PM 2.5 particles into the atmosphere which enter our respiratory system. This alternative no-burn rice farming practice introduces the use of biological soil amendment – Effective Microorganism (EM) – to effectively decompose rice crop residues within 2 weeks. The practice helps restore essential soil properties and improve soil-related quality, productivity, and micro-biodiversity. As a result, farmers can improve yields by 15%, resulting in estimated income gains from monsoon paddy by 13%. Index
Analysis ParametersGoal and scopeFunctional UnitAcre of no-burn rice farming practice The functional unit is represented by one acre of rice field managed according to Proximity Design's prescribed no-burn rice farming practice. Each acre is modeled with respect to the impacts associated with two growing seasons per year. Monsoon season is identified as the time that spans the months May to October while the summer season starts in November and lasts through April. There are different applications of inputs materials prescribed by the no-burn rice farming practice depending on the season which include effective micro-organism (EM), urea, and rice bran:
This functional unit has been chosen to best reflect the impacts of the no-burn rice farming practice with respect to the total acreage of farm land that employs this rice farming practice. BenchmarkOpen-field burning (incumbent management practice) The global benchmark reflects the emissions from the open-field burning that is common among many farmers in Myanmar. The farmers often do not have machinery to cut and remove the rice straw properly. Therefore, the leftover residues are often burned on open fields, leading to large emissions to atmosphere. Reference flowTypical rice yield in monsoon season is 1,043 kg / acre, and in post-monsoon summer season, the yield average is 1,877 kg / acre. GoalThe goal of this study is to analyse the potential of effective microorganisms to reduce carbon emissions compared to the conventional rice farming practice with burning rice straw residues. Reason for studyThe results of this study are useful for strategic planning and decision making of Proximity Designs. The study confirms the positive effects of EM on carbon emissions of rice farmers through the avoidance of rice straw residue burning. AudienceThe audience is primarily the staff of Proximity Designs, but also third parties that are interested in the product, such as investors or government officials. ScopeSystem BoundaryThe system boundary includes the farm management inputs inclusive of EM's, urea, rice bran, and fertilizer. Transportation of these materials to the farm as well as rice delivery to market are modeled as direct, Scope 1 emissions. There are associated benchmarks with many of these processes that model the incumbent system boundary within the same context and constraints. The primary avoided impact factor is the absence of burning, or a direct Scope 1 emission that would otherwise result in a significant portion of CO2eq per acre in addition to local air pollution. LifetimeThe following profile represents a farming practice that spans the timeline of one year. Each year, the practice is intended to be repeated and reflect a similar, of not the same, profile. Due to this farming practice, there may be longer ongoing effects that relate to the general soil health and other compounding factors. The positive biodiversity and soil sequestration implications of this practice could extend for several years, or decades, however, this research is still in process and there are no definitive results that can be quantified at this time. MethodologyMeeting international standardsThis analysis adheres to Lifecycle Assessment (LCA) methodologies outlined in ISO 14040, 14044, and 14067, ensuring a structured approach, potential comparability between solutions, and transparency for readers. The report is based on data available during the study and within the agreed scope. Results reflect the best available data and methodologies, with accuracy and reliability dependent on data quality and completeness at the time of the study. Limitations or uncertainties in the data are explicitly stated. The data used is precise (considering uncertainties and variability), complete (capturing all inflows and outflows within system boundaries), representative (aligned with geography, time, and technology), and consistent. It should be noted that LCA results depend on system boundaries, allocation methods, data quality, and assumptions; where deviations may affect outcomes. ClimatePoint impact analysts herein apply professional judgment and relevant standards while maintaining client confidentiality. Data QualityTechnology coverageThe effective microorganisms are a best available technology that leverage the synergistic effects of beneficial microorganisms to enhance crop productivity and resilience. Temporal coverageThe time of this study is 2023. Geographical boundaryThe geographical area of this study are rice fields in myanmar. Assumptions and limitationsThis report excludes the effects of applying effective microorganisms in other geographical locations. Functional UnitAcre of no-burn rice farming practice Executive SummaryKey revelationsThe use of commercial NPK fertilizer represents a significant emission factor with respect to the entire rice farming process. Through the use of EM during the no-burn rice farming practice, one out of four applications of NPK fertilizer can be skipped compared to the open-field burning method. Insights to Impact StrategyThe emissions that would have occurred as a result of the open-field burning practice are clearly very significant and the dedicated transitioning of farmers from this common practice to that of the no-burn rice farming practice represents a very strong alignment to a climate impact strategy. The results of research related to ongoing benefits of using EM's and not burning the rice straw could have compounding effects that maximize the perceived 'one-time' effects over time with year-over-year benefits. Continue to investigate and prove this impact perspective so that these implications can be modeled accordingly within this report. Potential ChallengesHerbicide and pesticide use have only been identified qualitatively and not quantitatively at this time. These unknowns have the potential to significantly impact the overall no-burn rice farming practice profile. Therefore, continuing to find opportunities to reduce the use of these products with respect to the incumbent open-field burning will reduce the significance of these unknowns. Finding impact data for these commercial products can often be difficult and confined to proprietary information, thus a conservative, high estimated impact should be assumed with further analyses. Possible ReboundsThe EM's contains a series of input compounds that reflect high embodied emissions. These are often the implications of products that are highly diluted due to the high concentration of input products. At this time, it represents a very significant emission factor, and the highest of the respective generated emissions. Climate Value PropositionProximity Design's key climate value lies in the application of EM's as an alternative to the common open-field burning of the rice fields in Myanmar. This no-burn rice farming practice results in a reduction of direct, Scope 1 emissions which are indicated by the respective green bar (downstream). The generated emissions (orange) in Scope 1, down represent impacts of transport. Meanwhile, the Scope 3, upstream impacts reflect the embodied emissions of EM's in addition to those embodied emissions of the other required farm production; urea, rice bran, NPK fertilizer. Life Cycle OverviewUnderstanding your emission profileThis process summary depicts an overview of the most significant emission factors that take place throughout your lifecycle activity. By viewing these intensities alongside each other, you can gauge their relative importance with respect to positive and negative extremes. Each process item listed on the horizontal axis will be described further in the Scope Allocation Analysis where readers can dive into the details behind each of the data points. While this model represents the complete overview, we make sure that each factor is supported by a sound methodology. Building your impact foundationSome process items may remain blank because the ClimatePoint team has considered them to be out of project scope, insignificant, or without enough information to analyse. These gaps should eventually be completed as you aim for your emission profile to approach higher levels of accuracy. Because of this presentation, you can understand which additional data is necessary to complete your entire impact profile and accommodate the dynamic growth and scalability of your company. ClimatePoint is here to help you navigate this pathway and optimize your impact strategy. Benchmark: Open-field burning (incumbent management practice)Impact Category: Climate change Process Overview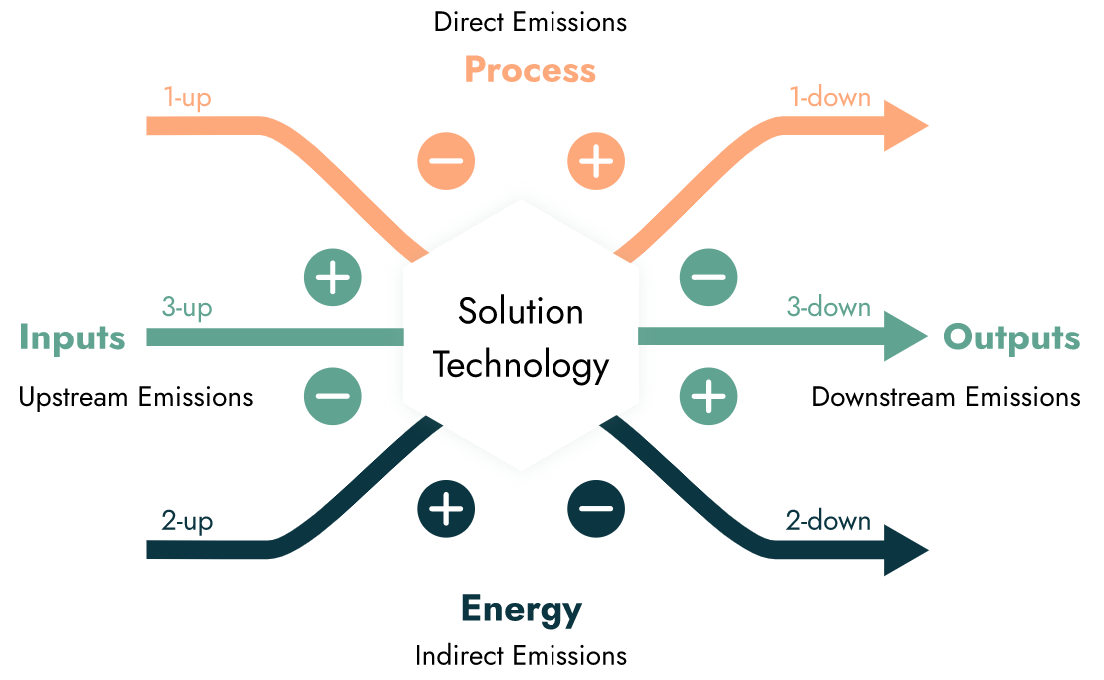 Connecting academia with businessThe scope allocation analysis is the ClimatePoint strategy to bridge the LCA emission assessment to the world of corporate GHG reporting. When our team approaches a new technology, we start with the most significant aspects that outline both your generated emissions and your avoided emission impact. The following process items represent these key factors backed by a defined methodology approach. This format permits the technology to be strategically aligned with our global climate targets, challenged for verification, and refined with evolution and growth. As the climate solution matures, we can easily update or add process items making this a truly dynamic report. This ClimatePoint approach integrates impact foundations outlined by the international community. To help you interpret the key climate aspects of your technology, we assign each process item two labels to serve as high level indicators. Your most significant climate impactThe "Score" evaluates processes based on comparative impact: Aligned signifies measurable emission reductions compared to the benchmark; Potential suggests possible alignment pending further verification; Negative denotes additional emissions; Rebound identifies emissions that would have otherwise not occurred with the benchmark; and None represents qualitative assessments. The "Priority" label ranks processes by importance: High indicates critical processes essential for achieving key sustainability objectives, warranting immediate attention; Medium represents processes contributing to the impact profile that require attention but lack urgency; and Low applies to supplementary processes with less immediate impact or those already aligned, allowing deferred action until higher-priority tasks are addressed. # Process item Scope Score Priority Impact AnalysisFunctional unit profileThis graph represents the aggregation of all the aforementioned emission factors with respect to the defined functional unit. By selecting a benchmark, the corresponding avoided emissions will also be displayed on the graph. This enables you to see the difference in the emission profile that this climate solution has to the incumbent technology. There is also an effect filter to identify which impact factors only occur once and which recur multiple times, usually throughout the lifetime use of the product or service. You can click the process labels in the legend to hide and show different elements to reveal further insights.
ProjectionsHow to read this section
Scenario 1: Planned impact (Organization market projections )This scenario includes the equivalent number of acres that can be treated based on the aggregated 5 L of EM required for both monsoon and post-monsoon seasons. The projections were provided up until 2027, which is why the scenario is modeled until that year. Benchmark 1: Open-field burning (incumbent management practice)The global benchmark reflects the emissions from the open-field burning that is common among many farmers in Myanmar. The farmers often do not have machinery to cut and remove the rice straw properly. Therefore, the leftover residues are often burned on open fields, leading to large emissions to atmosphere. Scenario 2: Single unit impact (per year per acre)This estimate presumes 3.358 mtons of rice produced per acre per year. Benchmark 1: Open-field burning (incumbent management practice)The global benchmark reflects the emissions from the open-field burning that is common among many farmers in Myanmar. The farmers often do not have machinery to cut and remove the rice straw properly. Therefore, the leftover residues are often burned on open fields, leading to large emissions to atmosphere. Scenario 3: Per mton of Rice (per year)This estimate presumes 3.358 mtons of rice produced per acre per year. Thus, acre has been divided by this amount to estimate the impact per ton of rice produced annually. Benchmark 1: Open-field burning (incumbent management practice)The global benchmark reflects the emissions from the open-field burning that is common among many farmers in Myanmar. The farmers often do not have machinery to cut and remove the rice straw properly. Therefore, the leftover residues are often burned on open fields, leading to large emissions to atmosphere. |
ClimatePoint Funding the Future ClimatePoint AS Universitetsgata 12, 0157 Oslo |
ClimatePoint AS, Universitetsgata 12, 0157 Oslo Follow us on X | Follow us on LinkedIn |